Introduction
Debugging is essential in both learning to use a game engine and in trying to sort out your inevitable mistakes. Without a debugger, I am constantly struggling, so it’s fortunate there is decent debugging support in Cocos Creator/Visual Studio Code. In this tutorial, we will look at how to set up the debugger and the basics of using it.
Setting Up a Debugger
There are a few hoops we have to jump through to get started debugging when using Cocos Creator. The first thing we want to do is enable Chrome debugging in Visual Studio Code. This, of course, assumes that you have the Chrome browser installed on your computer. If you don’t be sure to download and install it from here.
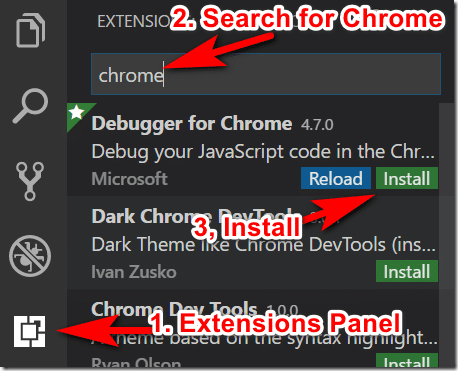
Next, in Visual Studio Code, we need to install the Visual Studio Code extension for Chrome debugging. In Visual Studio code, select the Extensions sidebar:
Now back in Cocos Creator select Developer->VS Code Workflow->Add Chrome Debug Settings.
Now you can run your project by selecting Debug->Start Debugging or by pressing F5.
Once your code is running you can control program execution using this toolbar:
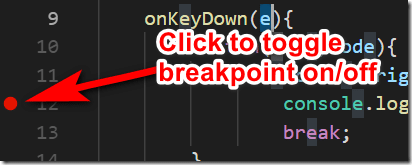
I’m not going to get in-depth into the debugging process in this tutorial, but thankfully I have already done an in-depth debugging tutorial. Cocos Creator also supports remote debugging (ie, debugging a game running on your Android phone from your PC) using JSB, but that is well beyond the scope of this tutorial. For more, very in-depth, details read this.


